Third-degree tides – tiny sea-level fluctuations once known only locally from measurements made by tidal gauges – have been mapped out across the globe by geophysicist Richard Ray at NASA’s Goddard Space Flight Center in Maryland, US. As well as helping to refine ocean tidal predictions, the work could find application in geodesy and in understanding the behaviour of the Earth’s crust and mantle, which tides affect.
In simple terms, tides occur because the Moon’s gravitational tug causes the oceans to bulge out in two places – one positioned beneath the Moon and the other on the opposite side of the Earth. The gravitational potential can be expressed mathematically in terms of latitude and longitude using spherical harmonic functions.
To model the Earth’s dominant tidal patterns, explains Ray, “it suffices to use just the three spherical harmonic functions of degree two. However, that is only a first approximation.” In reality, the tidal bulges are ever-so-slightly asymmetrical, with one side larger than the other. “To express that mathematically, we need higher degree spherical harmonic functions. Specifically, here we use functions of degree three,” says Ray.
Swamped in the data
The “third-degree” tides that arise from the tiny asymmetry are very small and their signal is easily swamped in tidal data – both by measurement noise and genuine non-tidal oceanographic signals.
“The tides are fairly obscure, because they are so small, but they can be detected in coastal tide gauges if the time series is long enough, say 10 years or longer,” Ray explains. “Away from these isolated tide gauges, little information about them has existed; no one had ever seen a global map of these waves from direct measurements.”
Today, maps of second-degree tides on the open ocean are made today using satellite altimetry observations. Records have been collected for some three decades, so researchers like Ray can search for third-degree tides. “The nice thing about going fishing for a time-coherent signal – like tides – is that after lots of averaging, even a tiny signal can eventually begin to emerge from the background noise.”
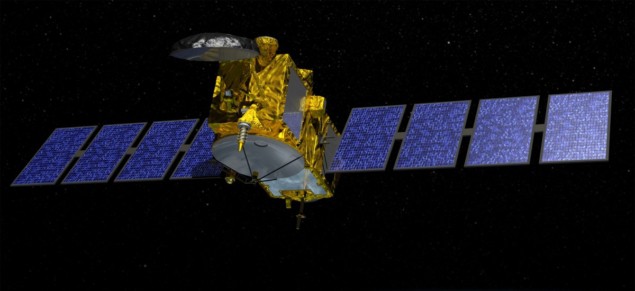
In his study, Ray worked with altimetry data collected by the TOPEX/Poseidon and Jason satellites, which operated from 1992–2005 and 2001–present, respectively. Ray used an averaging process that involved using a least-squares fit to sine waves of known frequency, which revealed the tidal amplitude and phase at each ocean location.
Distinctive pattern
The findings revealed a pattern of third-degree tides that was quite distinct from their second-degree counterparts. Ray says that this is a result of the spherical harmonic forcing being so different in each case. “Depending on the tidal forcing, its frequency, the ocean depth, and the shape of a basin, tidal waves can have certain resonances, some with unusually large amplitudes,” he adds.
The maps revealed that in the Atlantic Ocean, for example – where regular, second-degree diurnal (daily) tides are relatively suppressed – third-degree tides are relatively large. They reached even greater amplitudes in the Indian Ocean. In the South Pacific, meanwhile, third-degree tides were suppressed and barely reached 2 mm in height.

Seismic monitoring reveals tidal stresses in the Earth’s crust
Philip Woodworth, a researcher at the UK’s National Oceanographic Centre in Liverpool says, “The largest third-degree tide, called M1, has been mapped previously around parts of the global coastline and at islands using tide gauges, but this is the first time they have been mapped over the whole ocean”.
Edward Zaron at Portland State University adds, “It is truly astounding when you consider that the millimetre signals are here being extracted using data from satellites flying above the Earth at about 1300 km elevation, and it is a testimony to the precision of the satellite orbit determinations and geodetic sciences in the current age”. He concludes, “Richard is a master of these analysis techniques and their application to satellite altimetry”.
With his initial study complete, Ray is now looking to refine the accuracy of his tidal maps. “The results are still fairly noisy,” he says. “I’d like to apply formal data assimilation methods, which combine theory from fluid dynamics with measurements, to get the best of both.” He adds that the collection of more altimetry data in the future will also yield better results.
The research is described in Science Advances.
